Network Analysis and Text Sentiment of Tweets from members of the US House of Representatives
Twitter has become a popular platform for politicians to express their political views and to engage in debates and conversations with their constituents and other politicians. This is especially prevalent in the United States system and most members of the House of Representatives and Senate have official twitter handles. These members post tweets and retweet other politicians to express support or remark on the tweet’s content. The social network formed from politicians linked by retweets provides an interesting approach to quantify the roles of individuals and the level of disconnect across party lines. Additionally, the contents of the tweets offer information on the topics of most importance to the parties. For the following analysis, only the members of the 115th House of Representatives shall be considered as it has the most members.
1. Network Analysis
Using the Twitter API, the most recent tweets of the official House of Representatives accounts were acquired. In the text of a tweet, the “RT @” expression denotes a retweet and is immediately followed by the twitter handle of the user being retweeted. Natural language processing tools allowed such relations to be parsed from the text. A directed graph was then constructed in python to model this retweet network, with nodes corresponding to the twitter handles and an edge from node A to node B corresponding to user A retweeting user B. We disregard self-retweets. The resulting graph is pictured below, with members of the Democratic Party colored in blue and members of the Republican Party colored in red.
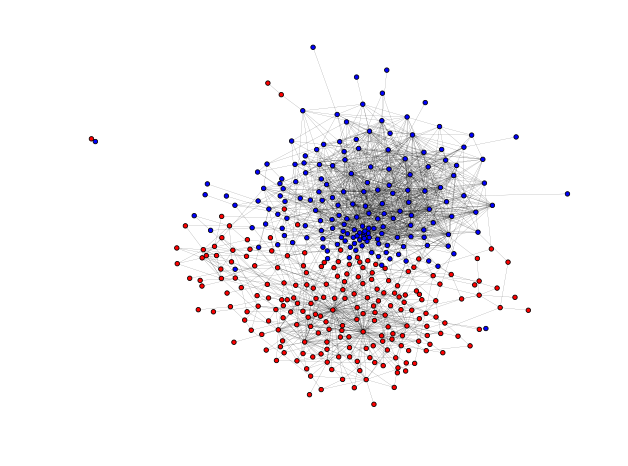
The Republican accounts with the greatest degrees are, in order, ‘SpeakerRyan’, ‘SteveScalise’, and ‘GOPLeader’ who is better known as Kvein McCarthy. The top Democratic accounts are ‘Nancy Pelosi’,’RepMarkPocan’, and ‘WhipHoyer’.
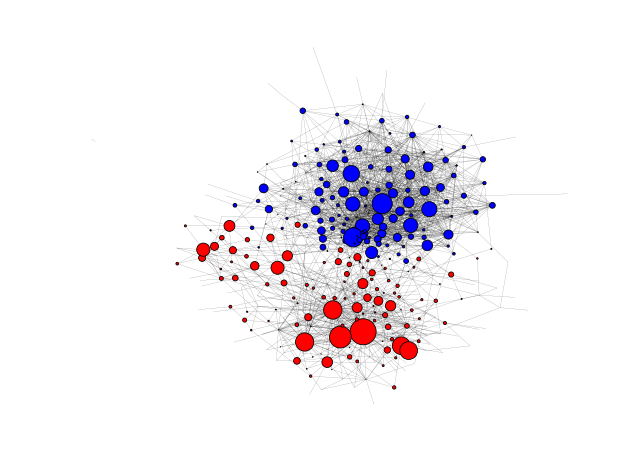
It’s also interesting to visualize the graph with the nodes’ sizes reflecting the magnitude of their betweenness centrality (shown below). Betweenness is a measure of how often a node lies on the shortest path between other nodes in a graph. In this context, it reflects how active someone is on Twitter, i.e. how many users they have retweeted or been retweeted by. Examining the graph, it appears that the Democratic members are much more active and have more retweet connections. The Republicans have some individuals with a large betweenness, but distribution is quite uneven.
We can also visualize the graph with the nodes’ sizes reflecting the magnitude of their eigenvector centrality (shown below). This measure is akin to “page rank” in that a high score means that the user is often retweeted by those who themselves are highly retweeted. This is in turn a good measure of trustworthiness. Users who are highly retweeted should have a higher chance of being credible and thus their opinions and retweets should be lent strong weight.
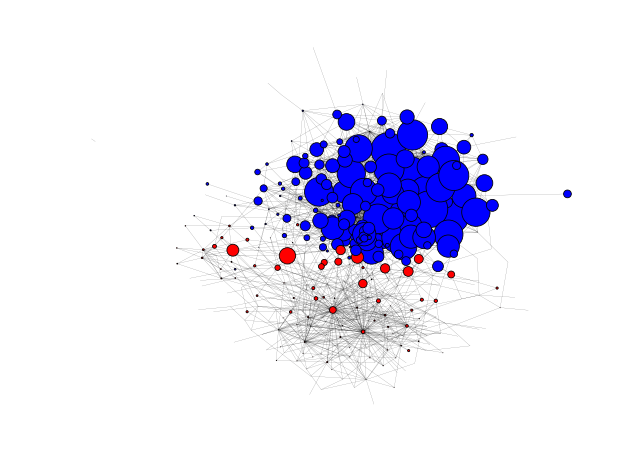
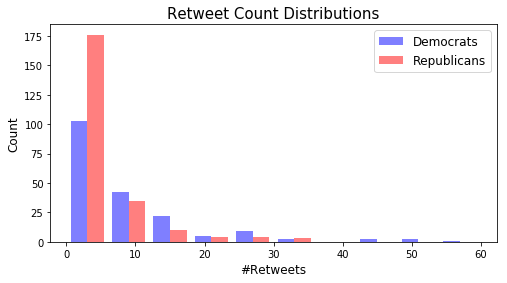
Examining the graph, it appears there are fewer credible Republican members and that they also have an uneven distribution. The lack of credibility, however, may simply reflect less retweet activity by the Republicans in general. Below are the distributions of the retweets and although there are more Republicans in the House, the Democrats appear to show a heavier right tail than the Republicans. Indeed, the average Republican retweets 4.37 other House of Representatives politicians while the Democrats average 7.80.
Based on the graphs, it seems that most of these retweets and links exist between users of the same party. Thus, an interesting question is which members most retweet members from the opposite party. For the Republicans, the top three are ‘RepFredUpton’, ‘RepTomReed’, and ‘RepTomMarino’. The top three democrats are ‘RepRoybalAllard’, ‘daveloebsack’, and ‘RepSwalwell.’ A possible explanation for some of these results is that the individuals represents regions in states that tend to vote as a whole for the other party. This is certainly true for Dave Loebsack, the only Democrat in Iowa, and Tom Reed, a conservative in the state of New York.
So far, however, we have assumed that the twitter network reflects the real-world political alliances and a dominant two-party system. We seek to confirm this assumption using the [Louvain] (https://github.com/taynaud/python-louvain) [1] method for community detection. A total of nine communities were identified. The network below identifies communities by distinct colors and the confusion matrix reveals the relative composition of Democrats and Republicans in each community.
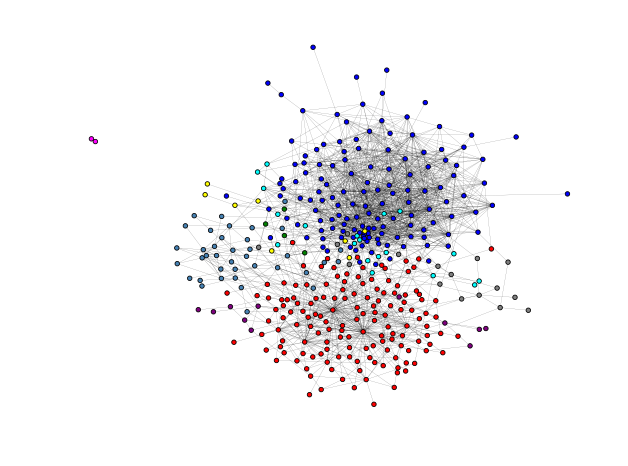

The community detection algorithm appears to slightly sub-divide the parties but there still exist two large and partisan communities with seemingly no members grouped in from the opposite party. Some of the small sub-divisions appear to have some slight overlap. This confirms out assumptions of a divided political system, split among party lines. Some of the detected communities appear to be mostly noise, but some of the larger ones may be explained by entities such as congressional caucuses like the Freedom Caucus.
2. Sentiment Analysis
The next part of our analysis involves examining the contents of the tweets. Preprocessing of the contents involves removing twitter handles, punctuation, numbers, and the python NLTK package’s list of stop words. We did not, however, remove the text portion of hashtags. Although they often aren’t English words but rather a conglomerate of words, they are an important feature of Twitter that individuals use to identify the topics of their tweet. The wordclouds of the contents of the tweets are shown below, with the size of the word proportional to its TF-IDF score. A TF-IDF (term frequency-inverse document frequency) score for a given word and document is large if the word appears frequently in the document but infrequently across all documents. Thus, the higher the TF-IDF score, the more important and unique a word is to the specific document. In this case we have two documents, each one being the collection of tweets from one of the two parties.
Words used by Democratic representatives (left), Words used by Republican representatives (right)

The hashtags appear to be the largest, and thus most used, terms in the tweets. We also clearly see topics of importance to each political party. An important thing to note is that based on the formulation of the TF-IDF score, any term used in tweets from both parties will have a score of zero and thus won’t appear in the word cloud. Thus, we only see words that are party specific. We can gain further insights by utilizing sentiment analysis. Sentiment analysis aims to determine the attitude of a collection of words, where each word maps to a given sentiment score. The sentiment score came from the labMT 1.0 data from the Mechanical Turk study which contains 10,222 words and their evaluated average happiness score [2]. The sentiment score for each tweet was calculated as the sum of the sentiment of each of the words in the tweet. A word not in the labMT data added no sentiment. We then normalized the score to adjust for tweets of differing lengths.
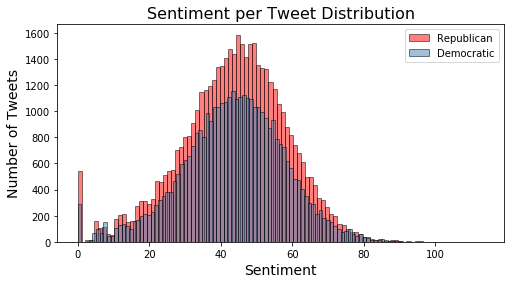
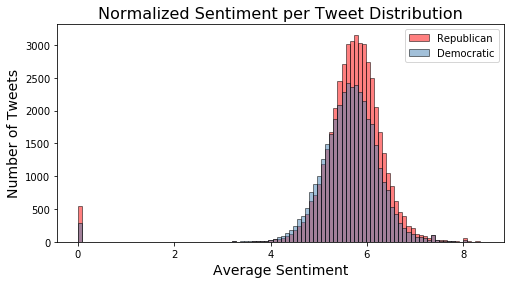
The distributions are very close in their center and spread, but the Republicans appear to have more tweets. Additionally, the normalized Democratic distribution is shifted slightly to the left of the Republican distribution.
Next, using the normalized scores, we considered only tweets of extreme sentiment. Calculating the average normalized sentiment and standard deviation, tweets with a normalized sentiment less than two standard deviations below or more than two standard deviations above were respectively categorized as negative and positive tweets. Their TF-IDF weighted word clouds are shown below and reveal topics associated with extreme partisan emotion.
Democratic negative tweets (left), Republican negative tweets (right)

Democratic positive tweets (left), Republican positive tweets (right)

Interestingly, the positive word clouds seem to be sparser, indicating fewer positive words specific to a party. A possible explanation for this is that it is very easy to criticize on Twitter. Negative news and headlines tend to attract attention and spur constituents more than positive events do. Thus, it is more worthwhile to discuss the negative than the positive. We can also see evidence of prominent news at the time that these tweets were mined and the perspectives of the parties. Most notably, we see the name ‘Kavanaugh’ in the Republican positive word cloud and the hashtag ‘believesurvivors’ in the Democratic negative wordcloud. Both the network analysis and the sentiment analysis indicate strong partisan divisions over twitter.
Citations
[1] Blondel VD, Guillaume J, Lambiotte R, and Lefebvre R, Fast unfolding of communities in large networks, Journal of Statistical Mechanics: Theory and Experiment 2008(10), P10008
[2] Dodds PS, Harris KD, Kloumann IM, Bliss CA, Danforth CM (2011) Temporal Patterns of Happiness and Information in a Global Social Network: Hedonometrics and Twitter. PLoS ONE 6(12): e26752.


